Monitor RaspberryPi 1 today
2024-04-05
The time I revived the Raspberry Pi 1 and used as a VPN exit node as told here, I also wanted to make sure I could monitor my Raspbian 12. Considering the limited resources and the old architecture, I had to find a lightweight, free way for monitoring it.
After investigating a bit I realised Grafana Cloud (free tiegr) and prometheus + node_exporter could be a perfect match.
The only issue here is to find a compatible release with this outdated architecture.
I eventually made things work using the following (I updated the releases to the latest minor version):
Set up the Grafana account
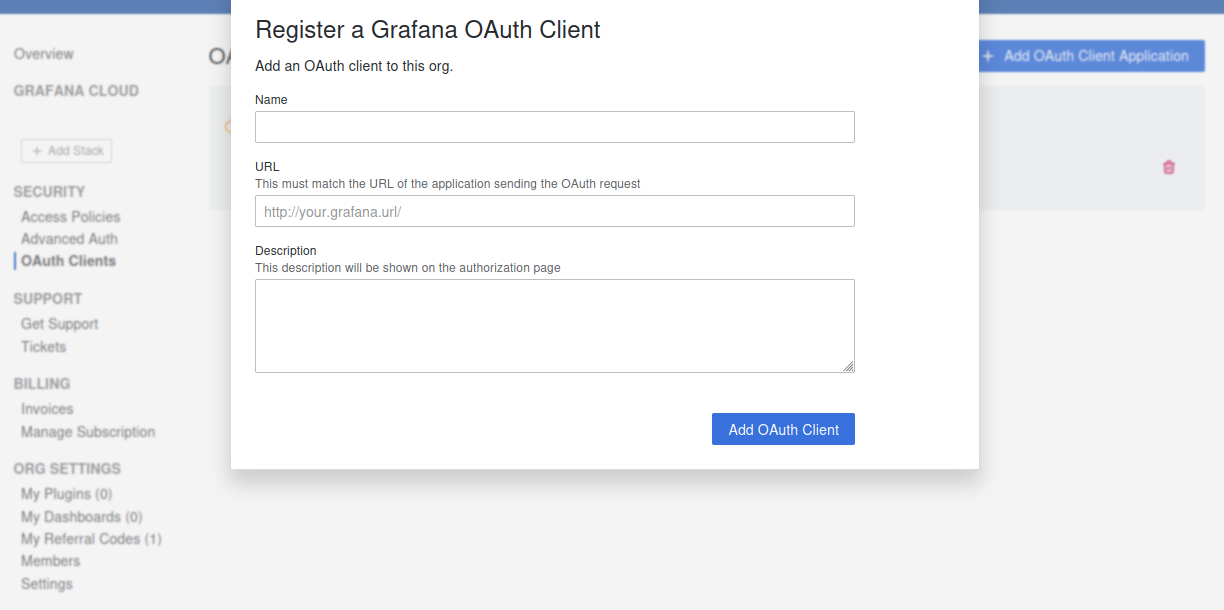
Let’s start with creating a Grafana Cloud free account. Register here. Once you are register, in the Grafana Cloud dashboard create a new OAuth token under “Security -> OAuth Clients -> Add OAuth Client Application”. Once the token is returned store it somewhere as you are going to use it soon when setting Prometheus up. If you lose it, simply generate a new one.
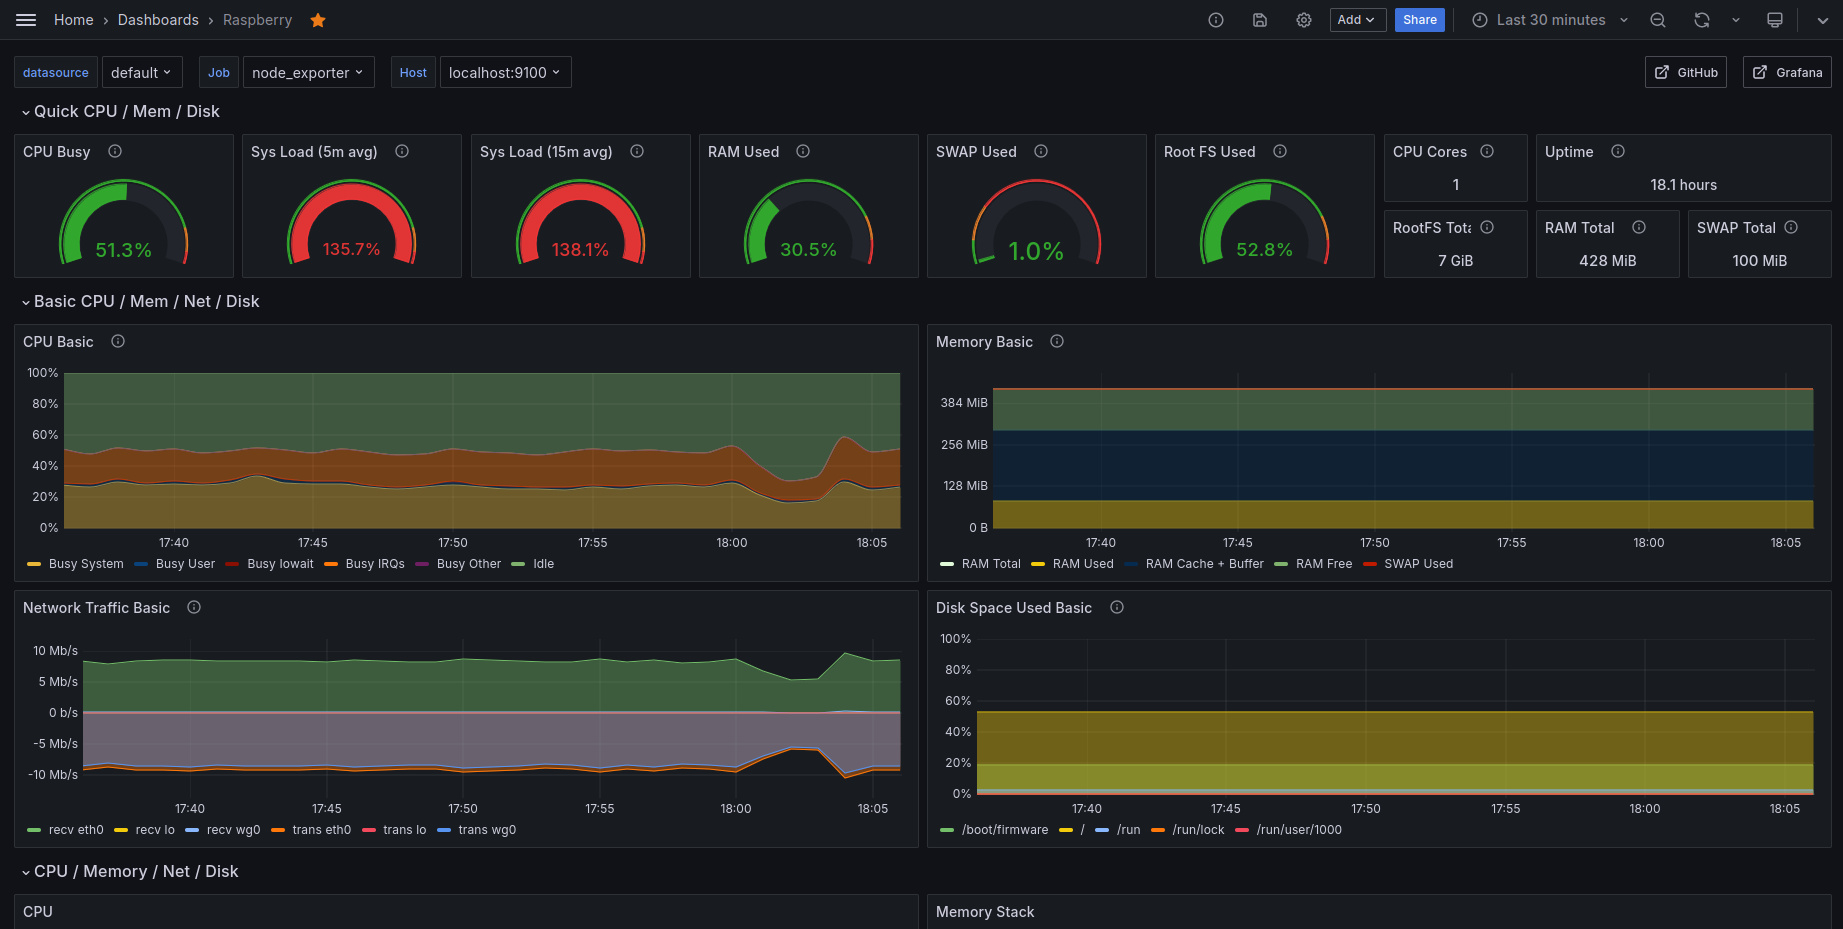
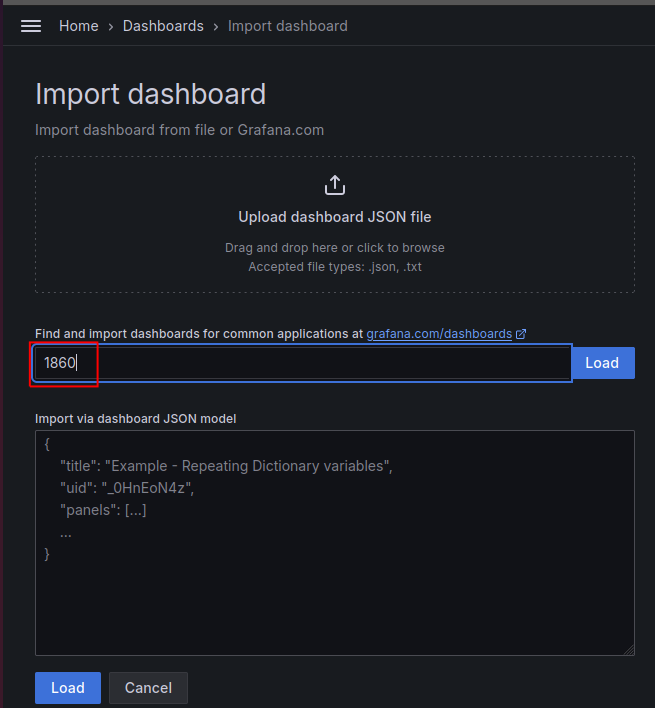
We can also start importing our dashboard for later. So let’s go to Grafana and let’s add the node_exporter full Grafana dashboard (id 1860)
Set up node_exporter
wget https://github.com/prometheus/node_exporter/releases/download/v1.7.0/node_exporter-1.7.0.linux-armv6.tar.gz
Let’s make the node_exporter as a service, by also making it available by the shell on PATH (you can still use your /home path if you want). In this case, node_exporter will run at boot:
$ tar xzvf https://github.com/prometheus/node_exporter/releases/download/v1.7.0/node_exporter-1.7.0.linux-armv6.tar.gz
$ sudo cp node_exporter-1.7.0.linux-armv6/node_exporter /usr/local/bin/node_exporter
$ sudo cat <<EOF >> /etc/systemd/system/node_exporter.service
[Unit]
Description=node_exporter service for Prometheus
After=network.target

[Service]
Type=simple
ExecStart=/usr/local/bin/node_exporter

[Install]
WantedBy=multi-user.target
EOF
$ sudo systemctl enable node_exporter.service
$ sudo systemctl start node_exporter.service
$ sudo systemctl status node_exporter.service
● node_exporter.service - node_exporter service for Prometheus
     Loaded: loaded (/etc/systemd/system/node_exporter.service; enabled; preset: enabled)
     Active: active (running) since Fri 2024-04-05 23:58:11 CEST; 16h ago
   Main PID: 736 (node_exporter)
      Tasks: 7 (limit: 387)
        CPU: 6min 10.777s
     CGroup: /system.slice/node_exporter.service
             └─736 /usr/local/bin/node_exporter

[...]
If you see something is failing, use journalctl -u node_exporter.service to print the full logs.
Set up Prometheus
Assuming node_exporter is running, let’s get Prometheus also up and running. If node_exporter is not running fix that before moving to this section.
wget https://github.com/prometheus/prometheus/releases/download/v2.45.4/prometheus-2.45.4.linux-armv6.tar.gz
tar xzvf prometheus-2.45.4.linux-armv6.tar.gz && cd prometheus-2.45.4.linux-armv6/
mv prometheus.yml prometheus.yml.bak
At this point, following Grafana’s official documentation would make no difference. I strongly encourage to go through the doc.
Let’s paste our prometheus.yml file, with this content:
cat <<EOF >> prometheus.yml
# my global config
global:
scrape_interval: 60s # Set the scrape interval to every 15 seconds. Default is every 1 minute.
evaluation_interval: 60s # Evaluate rules every 15 seconds. The default is every 1 minute.
# scrape_timeout is set to the global default (10s).
# Alertmanager configuration
#alerting:
# alertmanagers:
# - static_configs:
# - targets:
# - alertmanager:9093
# Load rules once and periodically evaluate them according to the global 'evaluation_interval'.
#rule_files:
# - "first_rules.yml"
# - "second_rules.yml"
# A scrape configuration containing exactly one endpoint to scrape:
# Here it's Prometheus itself.
scrape_configs:
# The job name is added as a label `job=<job_name>` to any timeseries scraped from this config.
- job_name: "node_exporter"
# metrics_path defaults to '/metrics'
# scheme defaults to 'http'.
static_configs:
- targets: ["localhost:9100"]
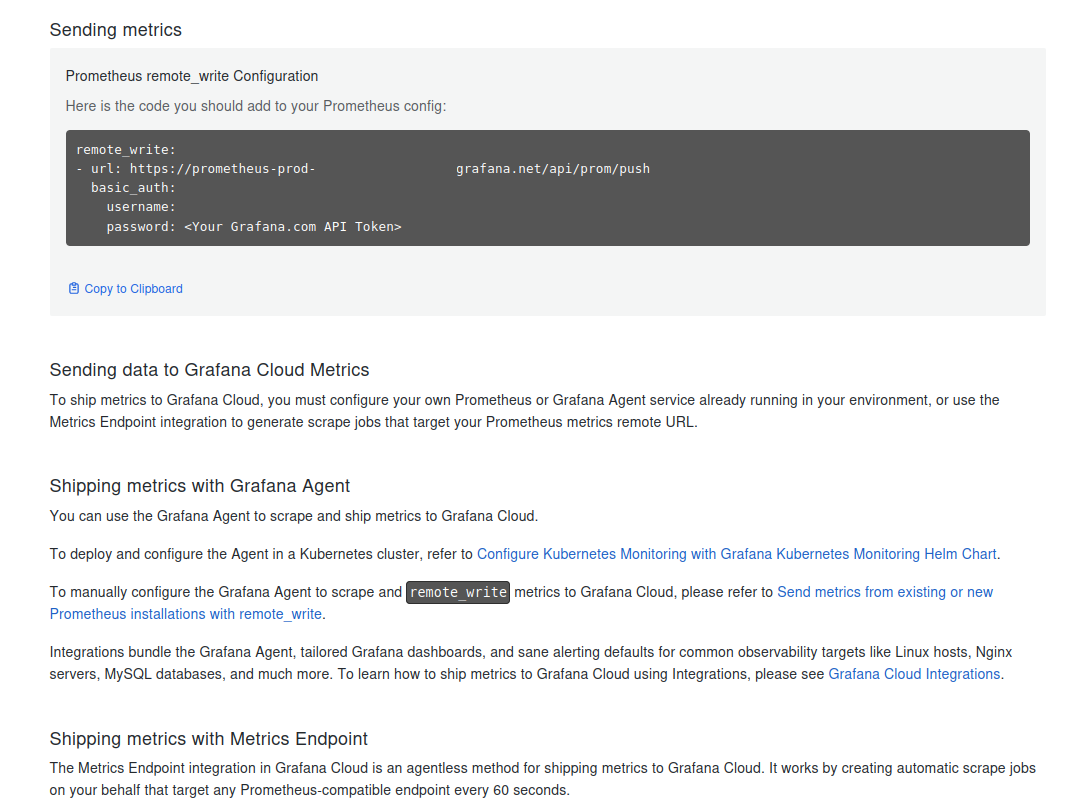
remote_write:
- url: <Your Metrics instance remote_write endpoint>
basic_auth:
username: <Your Metrics instance ID>
password: <Your Cloud Access Policy token>
EOF
Replace url, username from what’s returned here:
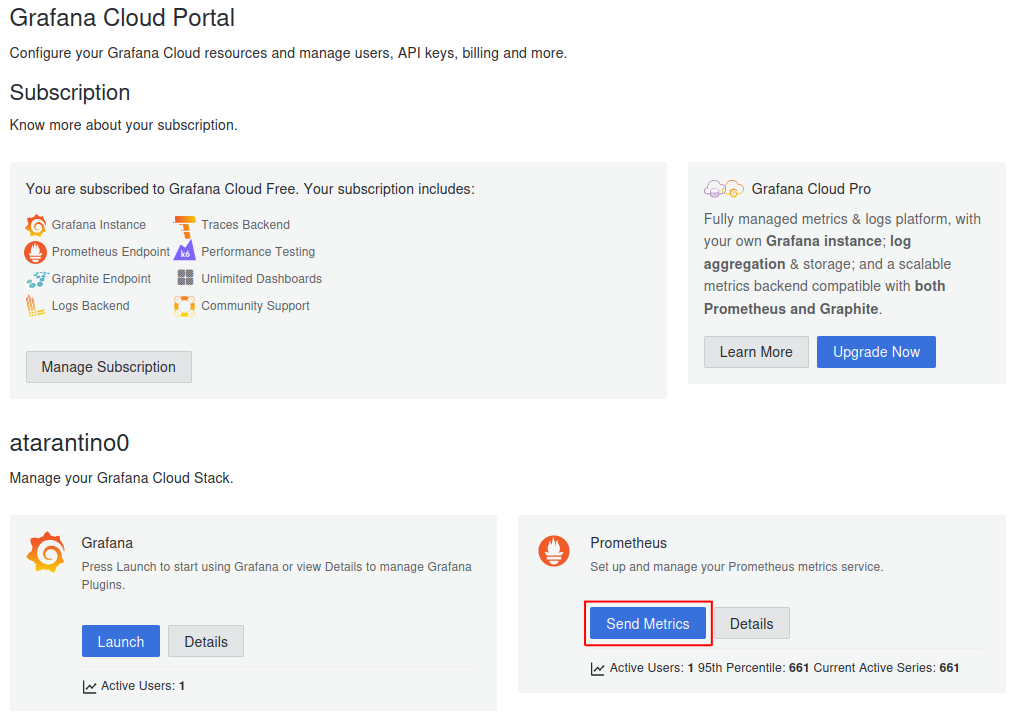
As you can see the remote_write section needs to be updated with real values, so do that before starting Prometheus, otherwise it will obviously fail.
Before moving any further I prefer to move stuff I want permanent off my ~, so let’s also move Prometheus to /usr/local/bin/ and the config file to /etc:
cd ..
sudo mv prometheus-2.45.4.linux-armv6/prometheus /usr/local/bin/prometheus
sudo mv prometheus-2.45.4.linux-armv6/prometheus.yml /etc/prometheus.yml
Now let’s make Prometheus a service too:
$ cat <<EOF >> /etc/systemd/prometheus.service
[Unit]
Description=Prometheus Service
After=network.target

[Service]
Type=simple
ExecStart=/usr/local/bin/prometheus --config.file=/etc/prometheus.yml

[Install]
WantedBy=multi-user.target
EOF
$ sudo systemctl enable prometheus.service
$ sudo systemctl start prometheus.service
Hopefully all is well and you should not see any errors when running:
journalctl -u prometheus.service
The end
At this point, assuming everything worked go to your Grafana dashboard and you should see your stats after 1 minute or 2.